Measuring speech intelligibility using Praat: Part I
In a nutshell
- This is Part 1 of a series of posts on writing a set of scripts to administer perceptual rating scale listening tasks using Praat software.
- I wrote a little script that runs a computerized visual analog scale (VAS) through Praat. It was designed to be used for administering speech intelligibility tasks in our lab, whereby participants hear an audio clip of somebody speaking, and must rate how intelligible (i.e., understandable) it was to them along a scale, for example, from “low” to “high.” It is adaptable to any perceptual experiment designed to be delivered in VAS form.
- This post will walk through the motivation for automating listener tasks like this and a demo of how it works.
- An upcoming post will provide a step-by-step of how it was written in Praat (in large part as a reminder to future me, in the inevitable case that I eventually forget what I did).
- Future posts in this series will introduce a script that allows for a listener to transcribe speech in Praat, rather than (or in addition to) rating it along a VAS. Come along for the joy of learning where the heck the backspace key lives in Praat, and other fun discoveries.
Clinical speech research
In my research, I work with people who have neurological speech disorders. That is, atypical speech production that arises due to abnormalities in the brain (for example, changes in the brain associated with Parkinson’s disease). Different aspects of spoken communication can be measured in multiple ways. For example:
- Acoustic analysis: What can the physical properties of the speech signal tell us about a person’s spoken communication? Are certain acoustic parameters deviant compared to otherwise healthy speakers? Can these acoustic differences help to explain the differences noticed by the speaker or by listeners?
- Self-perception: Do I, as a talker, notice differences in my own speech compared to those around me? Do those differences bother me? Do they impact my communication?
- Listener perception: Do the people that listen to me speak notice differences? Do these differences impact how much of my message they are able to understand?
The last two are examples of perceptual measures. Perceptual measures can take many forms, but one method we often rely on is the use of rating scales. That is, an individual is asked to rate some aspect of their own or another person’s speech. These ratings often take the form of descriptors (e.g., poor-fair-good), numbers (e.g., 1 to 10), or a position on a line with anchors (e.g., low to high). Perceptual measures can also involve listeners making more objective judgements about what they heard, for example, being forced to choose between two similar sounds or being asked to write down what they heard a speaker say.
Speech intelligibility ratings
Many people with speech disorders find it difficult to be understood by others. In the clinical speech world, the term speech intelligibility refers to the ability of a typical listener to understand a person’s speech (Yorkston et al., 1996). This is often referred to in percentage form and provided with the context in which it was measured. For example, “Bob was 85% intelligible during his reading of a short passage” means that people who listened to Bob reading some sentences aloud were able to understand approximately 85% of what he said. That could change depending on what Bob’s doing (reading vs. having a conversation), who’s listening to him (people who know him, people who don’t), the environment (in a quiet vs. noisy environment), and many other factors.
There are a few ways we can gather speech intelligibility estimates. One way is transcription; listeners write down exactly what they heard, and their responses are compared to what was actually said. Another method is estimation; listeners rate along a scale with anchors (e.g., “low” to “high”) how intelligible a spoken utterance was to them. One type of scale is what’s called a Visual Analog Scale (VAS), which consists of a line with anchors, along which the listener makes a tick mark to indicate their response. This post is about using tools for estimation, but the next post in this series will discuss transcription.
#🛠 The search for the right tool {#tools}
In our lab, we’ve frequently presented listeners with printed forms that they mark manually as they listen to audio clips. A goal of mine this year was to come up with a system to do the same thing but through an automated, computerized system (I do love me some semi-automation). Automating this kind of task takes a big chunk out of the time required to conduct analysis, and reduces the risk of manual input error (e.g., me messing up and entering the wrong number into a spreadsheet when my eyes are going blurry from entering hundreds of other numbers). In looking into my options, I found several viable routes:
Potential programs for creating an automated and computerized visual analog scale for listening tasks
Adaptive Visual Analog Scales (program)
- Hosted by the Neurobehavioral Research Laboratory and Clinic, this is a downloadable program that allows you to generate and administer computerized visual analog scales. Excellent! This is exactly what I wanted. But…
- My labmate, Daryn, was the one who found this program in the first place, and has successfully used it to run a listening experiment. She found that it got the job done, but found that the stimulus presentation (in this case, the presentation of audio clips) couldn’t be linked directly to the responses - you have to rely on the hope that your listeners stay on task the whole time. This opens up the possibility for responses to become out of sync with the audio clips, which can be a big problem. On her recommendation I looked into other more customizable options.
- PsychoPy is a set of tools that allow you to run experiments (similar to E-Prime), and is written in Python. The RatingScale function was one of the most promising options I found, and seems highly fit for the task. If you know Python and want to do something similar, this is probably a fantastic option.
- I, however, am a Python n00b and haven’t really used it in a few years. Given that I was looking for an option that would be usuable by early fall (this was August), I decided that learning PsychoPy wasn’t a good short term investment of my time. That being said, I will definitely return to PsychoPy options for future projects because I think it will probably come in handy for multiple tasks (also, becoming more proficient at Python is an eventual long-term goal regardless).
- Similar to PsychoPy, MatLab is a software environment and programming language that has many viable options for creating visual sliders that could be used as visual analog scales. I have seen posters that mentioned using visual analog scales that were generated using a custom MatLab script.
- Once again, my MatLab skillz are n00b level, though slightly higher than my Python skills. I seriously considered this option, as I’m actively learning MatLab now (as opposed to back-burnering it as I have with Python). In the end I decided I could be more efficient with another option (keep reading), but MatLab surely has some good answers too.
- NB A potential downside of MatLab is that it is not open source. I have access through my university, but in theory that could change…
- R Shiny is an R package that allows you to build interactive web app interfaces. While designed to be more of a data analysis tool, rather than an administrative experimental program, its functionality could in theory support building a visual analog scale (plus R is so elegant and R Shiny makes such pretty web-friendly interfaces). Linking it to audio is also probably well within the realm of possibilities, but not exactly what it’s designed to do. One major benefit with R Shiny could be the ability to incorporate the results immediately into whatever analysis you plan to run, if running it in R.
- Praat is the workhorse of acoustic analysis of speech. It is an incredibly powerful piece of software hidden behind an incredibly underwhelming logo. It also has its own scripting language that allows you to automate the functions you can perform with the software. A key feature for implementing this project was the fact that it also has a “Demo Window” that allows you to code up the kind of interface I had in mind 1, as well as the ability to seamlessly integrate audio files.
Ultimately, I chose Praat. I think all of these are great options, but in the end it came down to what was going to be the most customizable and efficient option for me. I’ve used Praat for more than a few years now, and while I recognize its pitfalls and relative weaknesses compared to other programming languages, I have a very warm spot in my heart for it. In the interest of efficiency (I’ve got less than a year left of this PhD…), I knew I could likely complete what I wanted to do in easily a third or less of the time it would take me to learn waht I needed to do in PsychoPy, MatLab, or R Shiny, and offered me more customizability than an already-built web app. The finished script can also easily be used by somebody who is not as familiar with Praat, and I may turn it into a plugin for even easier implementation one of these days. But today is not that day.
VAS in Praat: Tutorial
This is a brief tutorial on using the VAS script (vas.praat).
![]()
Demo
Note: There’s no audio in the clip, but it’s demonstrating what the process would be for two audio clips.
What vas.praat does
- Iterates through a directory of .wav files and plays them one at a time, with options to randomize the presentation and replay a subset of the files for reliability purposes
- Presents the listener with a visual analog scale (VAS)
- Allows the listener to click anywhere along the visual analog scale as they listen to the audio clip, and adjust their rating until they’re ready to move on
- Allows the listener to advance at their own pace, but not before the clip has finished playing, and not without making a mark on the line
- Prohibits the listener from advancing to the next audio clip if they haven’t marked the line, or if they try to advance before the audio is finished playing
- Logs the results to a .csv file for later analysis
- Logs the listener order and progress, allowing the listener to stop and pick up where they left off later (and the possibility to run other listeners in between)
Using the Praat demo window, the script essentially sets up an interface for the listener by defining the boundaries of the visual analog scale and “buttons”, and registers whenever the user clicks anywhere within those boundaries. If the click occurs along the line, the screen subtly updates and refreshes the mark. If the click occurs within the button to advance, the script checks whether that’s okay to do, and either advances or alerts the user as to why that can’t happen. It does all this through use use of a few core procedures, i.e., user-defined Praat functions which I’ll walk through in the next post in this series.
The code for the original core functions came during my search for any kind of Praat functionality for this kind of application. The code provided in José Joaquín Atria’s Praat scripting forum post about building a “scroll bar” proved to be the most important piece, which I was able to adapt for my purposes. The Praat forum is exceptionally helpful for finding useful code snippets in Praat and understanding more about how they work3.
In the next post, I’ll walk through the building blocks of how the VAS script works from a technical standpoint. For now, here’s what it’s like to run it.
Assumptions
For the script to run, the following criteria must be fulfilled:
- Audio files in .wav format are stored in one directory. All audio files will be played.
- The script,
vas.praat, is stored in this same directory
User options
The form defined at the beginning of the script (and is what pops up when you run the script) contains a bunch of fields for the user to fill out if they wish.
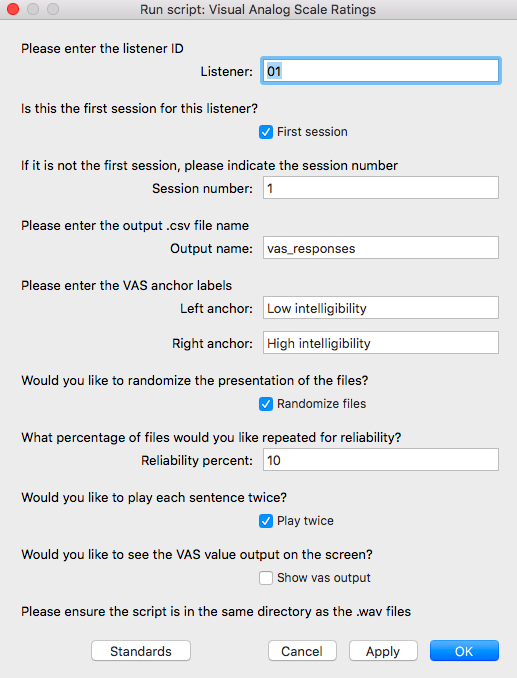
The user options can be grouped into the following categories:
Session info [Listener ID, Session number]
- Here the user (researcher) can enter important information for the session at hand. Most important is the listener ID, and whether this is their first session (i.e., the first time setting up a playlist for this listener). If it’s not the first session, the researcher can indicate which session it is on the next line.
Experiment info [Output filename, anchor labels]
- Things like the name of the output file where the results are logged and the anchor text are likely to be constants for a given experiment.
Other experimental options [Reliability, Sentence repetition]
- The user can also decide whether to randomize the presentation files; if they don’t, they will be played in alphanumeric order (as they would appear in the folder where they are stored). If they’d like a subset of the files to be repeated, they can specify the percentage of files to repeat (the script will round down to the nearest integer). There is also the option to permit that each audio clip play twice. If unclicked, the script will still give the option for the user to repeat the file, but it won’t do this by default.
Sanity check [VAS output visible on screen]
- The last option I included mainly as a sanity check to myself. If checked, the script will show the value that the listener has selected according to where they clicked along the line. This is probably not something you’d actually want a listener to see, but can be helpful in absolutely being sure that the script is doing what you want, and can be cross-checked with the output files.
Once satisfied, the user clicks Okay and the next page pops up for the listener.
Instructions to listener
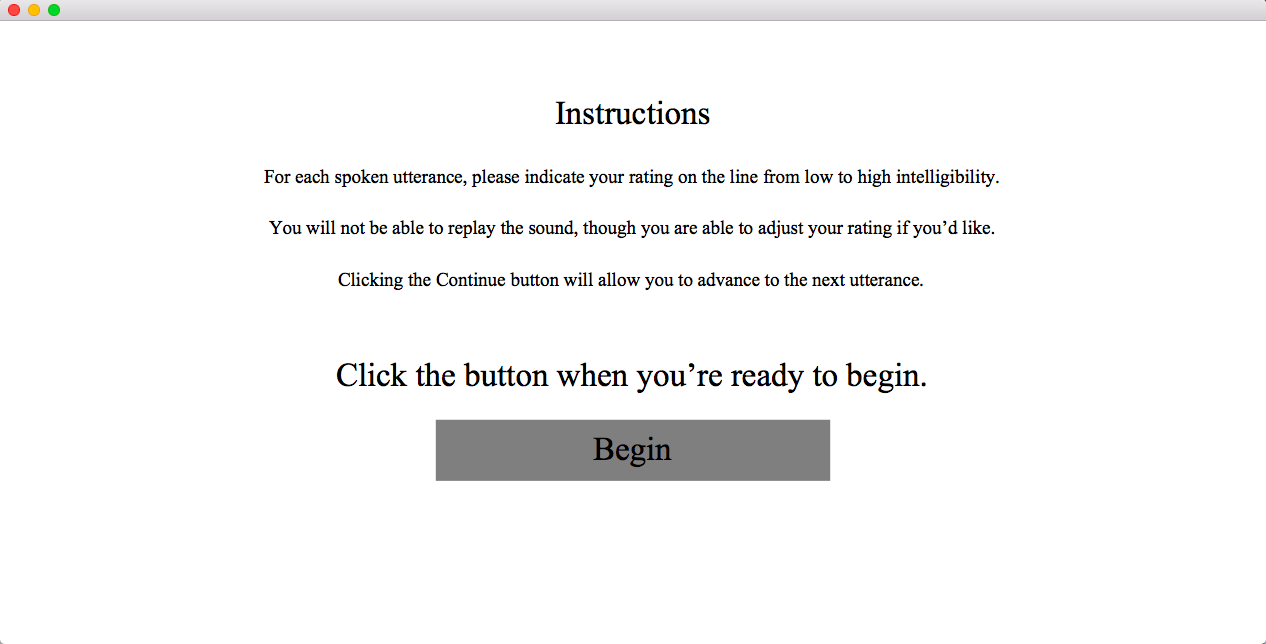
At this point, the researcher may wish to pass control off to the listener. This text can be modified in the script to suit whatever the instructions are you wish to convey. Once the listener presses “Begin”, the VAS screen will appear and the audio will begin playing.
VAS screen
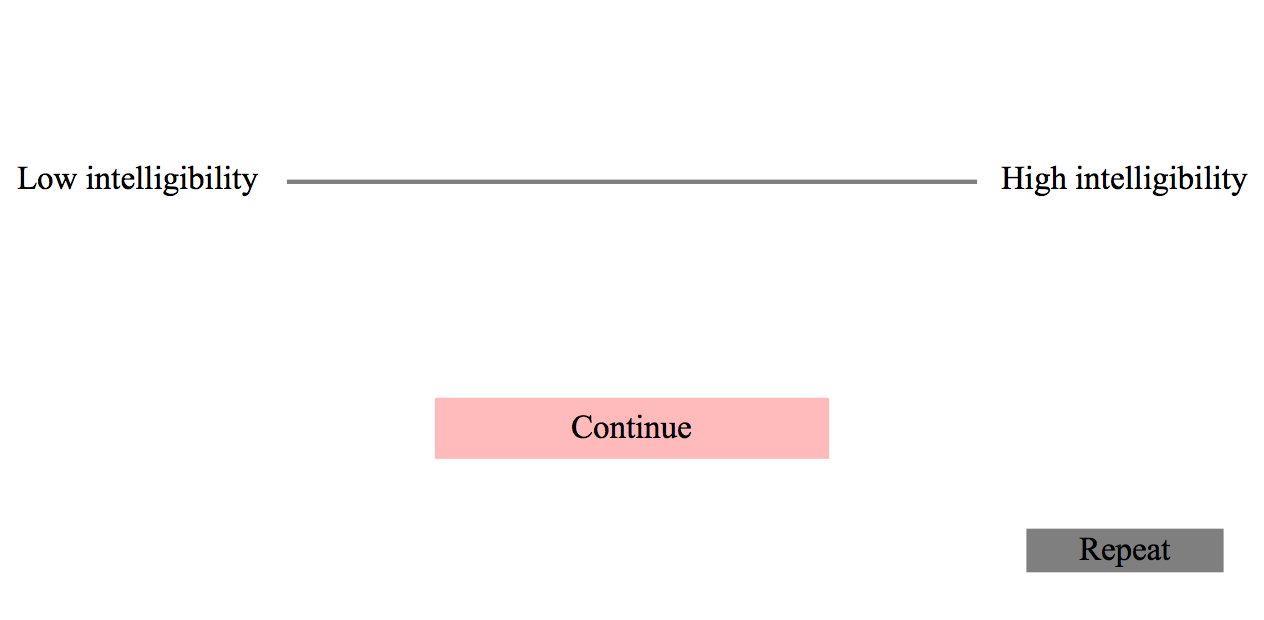
The user won’t be able to advance until they have made a mark somewhere along the scale, and the audio has finished playing. When they are finished with the last file, a pop-up informs them they’re all done.
Output
The main output is vas_responses.csv (or whatever you’ve chosen to name the response file), and looks like this:
##
## ── Column specification ────────────────────────────────────────────────────────
## cols(
##   filename = col_character(),
##   listener = col_double(),
##   session = col_double(),
##   order = col_double(),
##   percentage = col_double()
## )| filename | listener | session | order | percentage |
|---|---|---|---|---|
| file3.wav | 1 | 1 | 1 | 70.1921 |
| file5.wav | 1 | 1 | 2 | 58.3563 |
| file1.wav | 1 | 1 | 3 | 66.1045 |
“percentage” refers to the percentage along the line where the user clicked for that file. In this example it refers to “percent intelligible.”
Each time you run a new listener for the first time (i.e., first session), two other files are created (the following is assuming the listener ID is 01):
- listener_01_order.txt: logs the original order created during the randomization
- logfile_01.csv: logs the progress made by the listener
Multiple sessions for a listener
If the listener needs to leave before finishing all the audio files, you can just exit the script. The next time you run that particular listener, type their same ID into the form (make sure you label it the same way, i.e., 01 or 1, etc.), uncheck “First session” and type the accurate session number into the next field.
In this case, the script looks up their order and their progress, the two files that were generated during their first session. It looks up the last file they did in their logfile, finds it in the order file, and starts with the next file on the list in the order file.
⚠️ Important: At the present time, there’s no check built in to make sure you haven’t already run that listener. Here you just have to be diligent. Future versions will be diligent for you. It also doesn’t technically matter what you enter as a session number; all that really matters is that you have or haven’t clicked “First session”; the session number is just logged for your reference.
Outstanding additions I’d like to make but haven’t yet
- Should run from any permanent location
- Instructions should be more readily modifiable for user
- Should check whether listener ID/session combo has already been entered
- Progress bar/indicator/some output relating how many files are left to do
- Make as Praat plugin
- Other things I haven’t thought of yet? Quite possibly…
Hopefully somebody somewhere finds this useful. In any case, hopefully at least future me finds it more difficult to forget what I did as a result of this and the subsequent posts in this series. We have successfully used the script for a couple of listening experiments in our lab, and I’m pretty happy with how it’s turned out. Praat is clunky, sure, but I love it anyways, and I have to say it did just fine for the task at hand (without taking years off my life to figure out 🙌)
References
Thanks to Frits van Brenk via Twitter for pointing me in the direction of a the Praat NKI TEVA app, which, while I didn’t use directly, made me aware of the Demo Window and provided some solid working examples so I knew what to Google.↩︎
In fact, I believe I have come to use Praat the way others may use bash scripts; for file renaming, text manipulation, etc. Perhaps once again not the best tool for the job, but good enough for me in many cases.↩︎
The Praat Yahoo forum is the Stack Overflow of Praat.↩︎