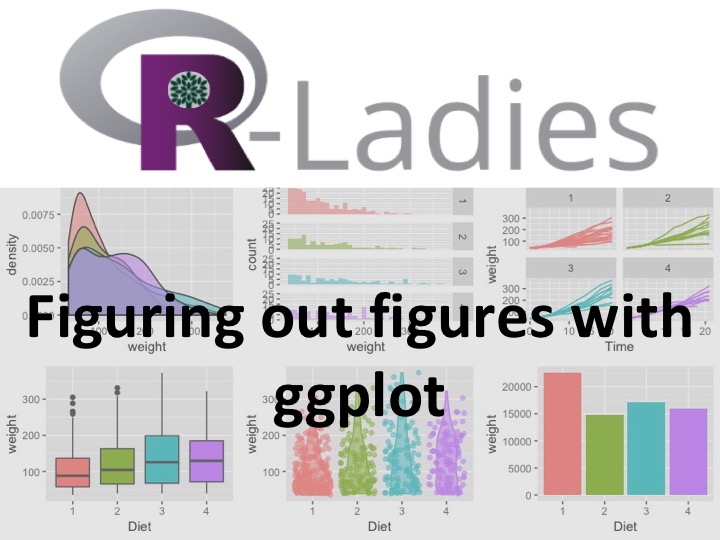
Workshop materials for R-Ladies #LdnOnt: Figuring out figures in R

I gave an intro workshop on ggplot (“Figuring out Figures in R”) for our R-Ladies #LdnOnt crew at the end of October. Those materials are online now in various forms:
- The slides themselves
- Github repo containing the source code to the slides, the data, and an .R script including some of the code we played around with
- Google Drive folder containing everything you can find at our GitHub (trying to be cross-platform friendly, here!)
This was a fun workshop to give because, to an extent, it is something I am fairly familiar with (I have plotted many a graph in ggplot), but there are still lots of unknowns to me. I’m exploring some new formats for visualization (e.g., I’m getting really stoked about joyplots1, aka ridgeplots lately for my dissertation) that I wanted an excuse to explore more in depth. There are a number of aspects of ggplot I have to look up
literally 👏 every 👏 time 👏 I 👏 use 👏 it
(cough, theme(), cough), and I wanted a good reference I could refer back to for that. I’d also been wanting to try out creating presentations in xaringan, and so I used this workshop as an excuse to get my hands dirty with that too.
That’s pretty much all I have to say! I am truncating my tendancy to turn these little “updates” into long rambly posts because there are a number of other things on my to-do list today, and it’s too easy to get carried away writing about R-Ladies fun shenanigans.
Named for their artful resemblance to the cover of Joy Division’s album, Unknown Pleasures↩︎